In the end of the first half of the year, arguably the most frequently mentioned words in the media were IPO and Facebook, which can be explained by the fact that the biggest social network finally went public on May 18.
This move generated hype around the company’s ‘price’—initial $38 per a share is really too much—and the actual value of the company, which in its turn inspired a plethora of studies and infographics, unveiling the real state of things on the global social media and advertising market. The themes include the Facebook’s real effectiveness in advertising, the way it will be evolving over the nearest time, the social network’s value and comparing Facebook, the largest technology and online company IPO, to other rival companies in both social media and advertising industries.
Click to enlarge
Though shares of Facebook, which now works both as a social and an advertising platform, seem to be a good investment at first sight, experts talk off from buying them right now and advise to wait at least six months. The rice is dropping. On May 30, Bloomberg reported that the Facebook Inc., “which has already lost $25 billion in value since its public debut, would have to drop another 20 percent for its valuation to match other companies that do business over the Internet.” The source informs that the Facebook stock would have to get reduced to $23.07 in order to “match the average price-to-earnings ratio for the Nasdaq Internet Index based on estimated earnings in the next 12 months”—the company’s predicted profit for 2014 is $2.69 billion. Today, June 5, the share’s price is around $26.7, and most likely it will continue to drop.
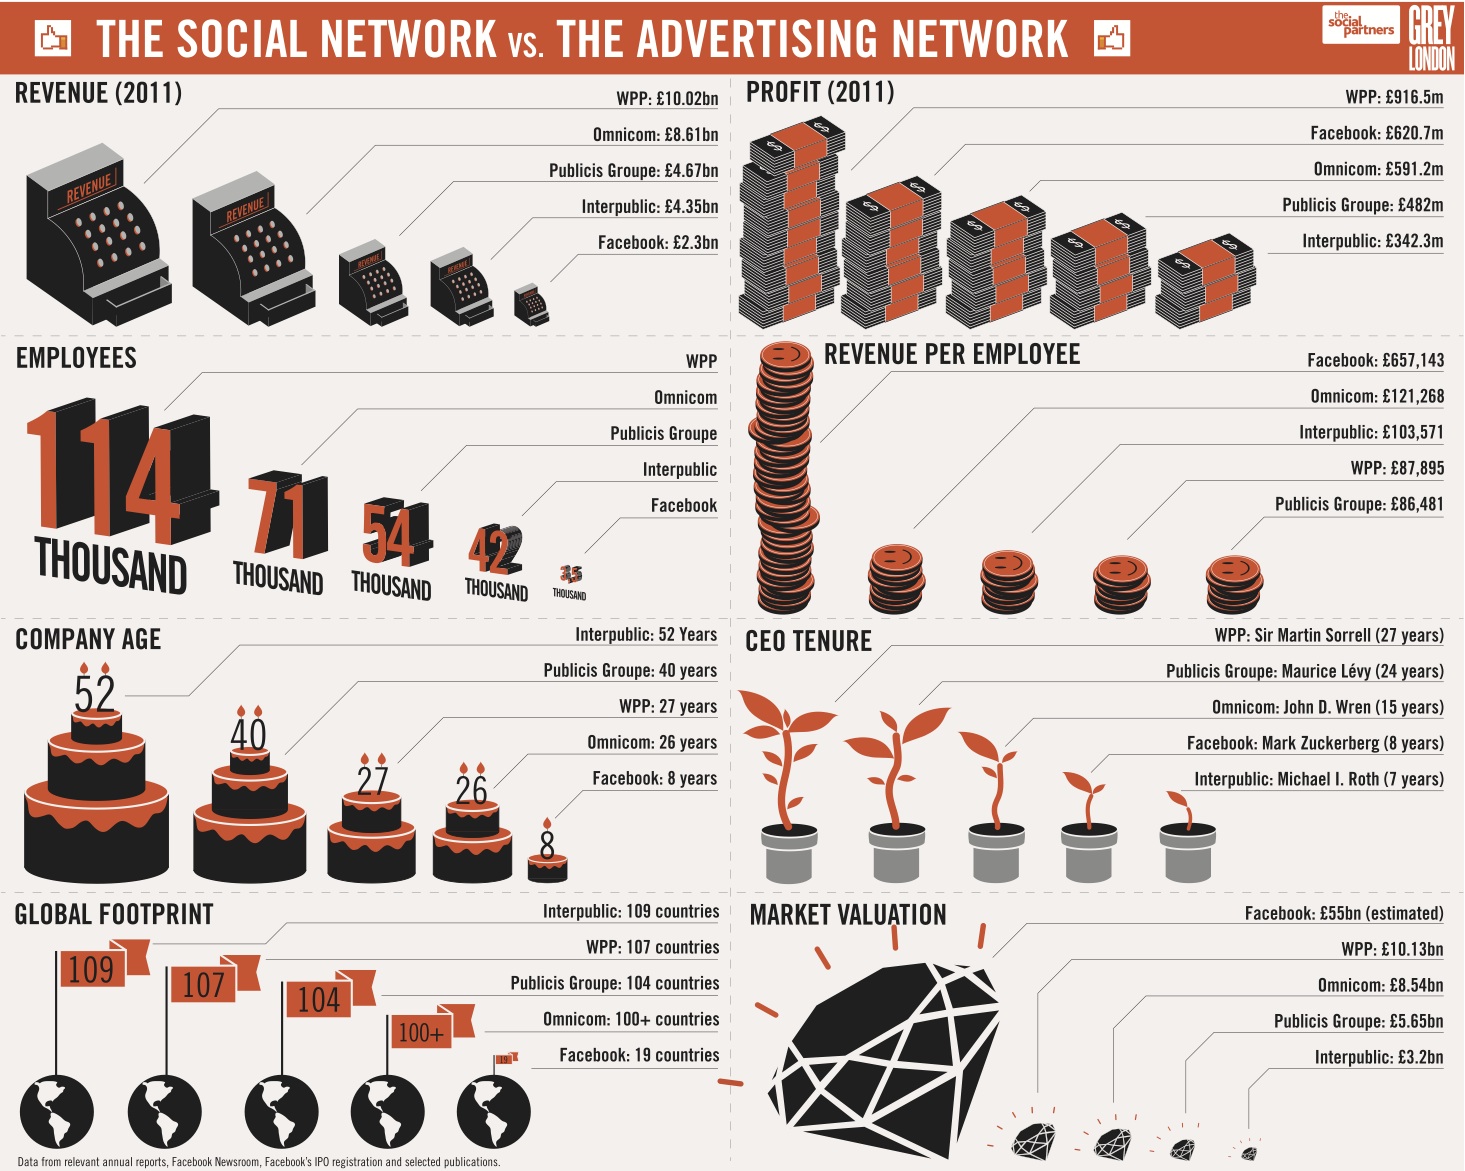
The infographics by Grey London compare the global ad networks such as Interpublic, WPP, Omnicom and Publicis Groupe to the social network across a few different metrics. The data was visualized ahead of Facebook’s IPO, and helps get a deeper insight into the basic information about the companies’ position on the market.
According to the infographics, Facebook gets on the top of the list twice, in Revenue per employee—£657.143—and Market valuation—£55bn estimated, while WPP turned out to outperform the rest of the companies in the Revenue (2011), Profit (2011) Employees and CEO Tenure. The biggest social network, which already has 900+ million active users, also ended up on the bottom of the four lists, Global footprint with 19 countries, Revenue with £2.3 bn and Employees with 3.5 thousand people and Company age of 8 years.
In the study on adspend across the globe Popsop wrote that according to Warc, “the digital advertising spend is expected to account for 20% of all media spend by the end of 2012.” This share is a real piece of cake, which will be eaten by Facebook among a few. The biggest social network, which already has Facebook Ads and Sponsored Stories ad formats, also continues to consolidate its mobile presence—soon, it will open the long-awaited App Center, which will allow users to find social apps for their mobile devices as well (users will be directed to Google Play or Apple App Store). On May 24, it has unveiled its Facebook Camera app for mobile, which comes to be a rival of Instagram—the popular app for transforming look and feel of a photo and sharing it with friends, which was recently bought by the company. The new app is to tie more users, who like to take photos, to the platform, and engage them more—the bigger and the more active users are, the bigger profit is.
In fact, advertising is the major source of revenue for Facebook now, but is that really effective? The General Motors company has recently said it’s not. The Wall Street Journal reported in mid-May that “General Motors Co. plans to stop advertising with Facebook Inc. after deciding that paid ads on the site have little impact on consumers’ car purchases.” In the infographics by WpordStream below you will see Facebook and Google advertising compared—the internet giant definitely beats the social media company in this area. Here are some major highlights from the infographics below.
—Facebook has 51% reach of all internet users with 1 trillion pageviews per month, while Google covers 90% of users and has 180 billion ad impressions served each month.
—Facebook doesn’t publish its average CTR, but independent analysis from Webtrends on more than 11,000 Facebook campaigns showed that the average CTR for Facebook ads in 2010 was 0.051, which dropped from 0,63 in 2009. The average CTR of an ad on the Google display network is 0.4%.
—According to TBG Digital, in Q1 2012 advertising rates on Facebook rose 40% and click-through rates fell 8%.
—Facebook has only two formats, while Google has four types of ads.
It is hard to tell for sure if Facebook will manage to turn the revenue received from selling shares into real profit for expanding the business and making shareholders rich and happy, but Facebook’s IPO is definitely an unprecedented move in the online companies’ history. The point is what Facebook will do to get really deep after going that wide?
Click to enlarge

